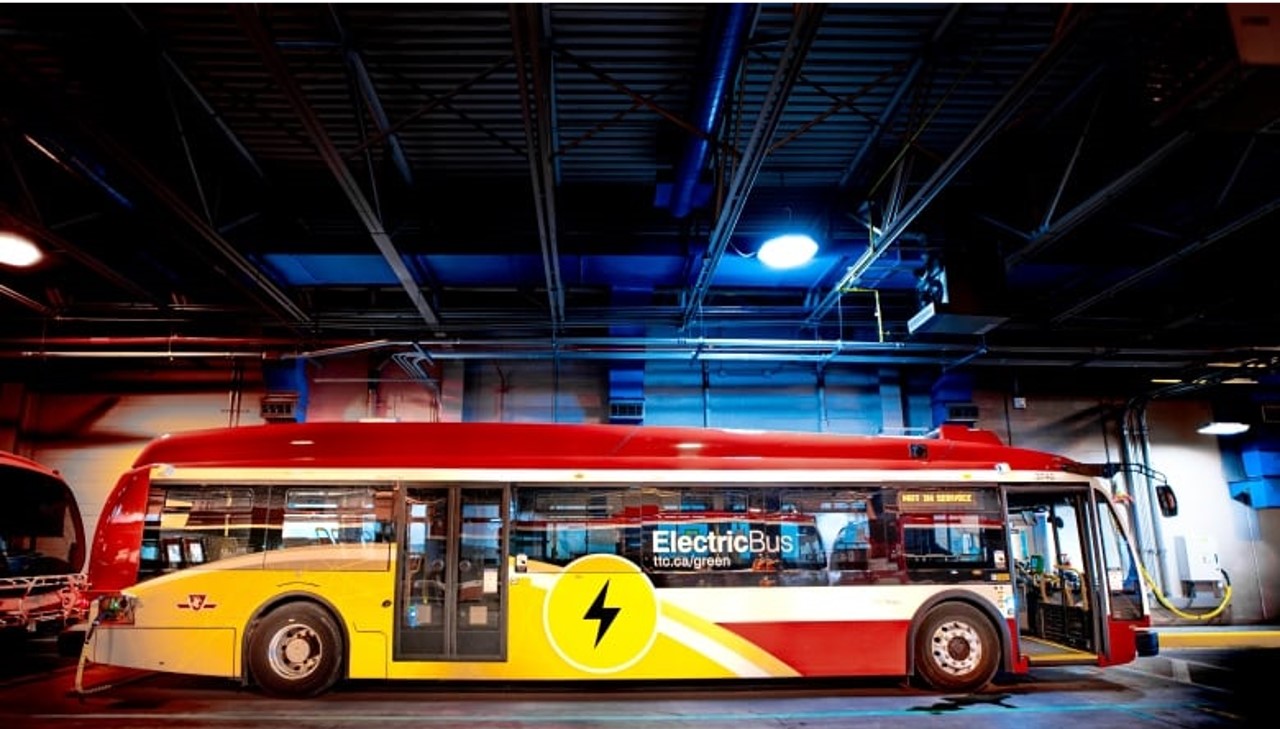
Toronto Transit Commission Electric Bus Program: Head-to-Head Evaluation of Electric Buses
Many cities around the world have pledged to phase out conventional fuel vehicles in favour of electric vehicles. Public Transportation agencies across the globe are also committed to transitioning entirely to electric vehicles and introducing electric buses into service. However, given the operational requirements of buses, the transition to full electrification is a complex process.
Toronto Transit Commission (TTC) has committed to achieving 50% zero emissions by 2028-2032 and 100% zero emissions by 2040. TTC is the city of Toronto’s public bus operator, with a fleet of 1,665 buses that use three different technologies: diesel, hybrid electric, and battery electric.
In general, city buses cover 200 km per day in a 16-hour shift. One of the most difficult challenges for public bus agencies is comparing the performance of various manufacturers. At the same time, these transit agencies must adhere to public procurement guidelines.
TTC followed a different approach for its transition and followed a head-to-head evaluation process to compare different technologies. TTC purchased 60 all-electric buses from three manufacturers. The first of 60 electric buses entered into operation in June 2019 and TTC initiated its head-to-head evaluation process in October 2020.
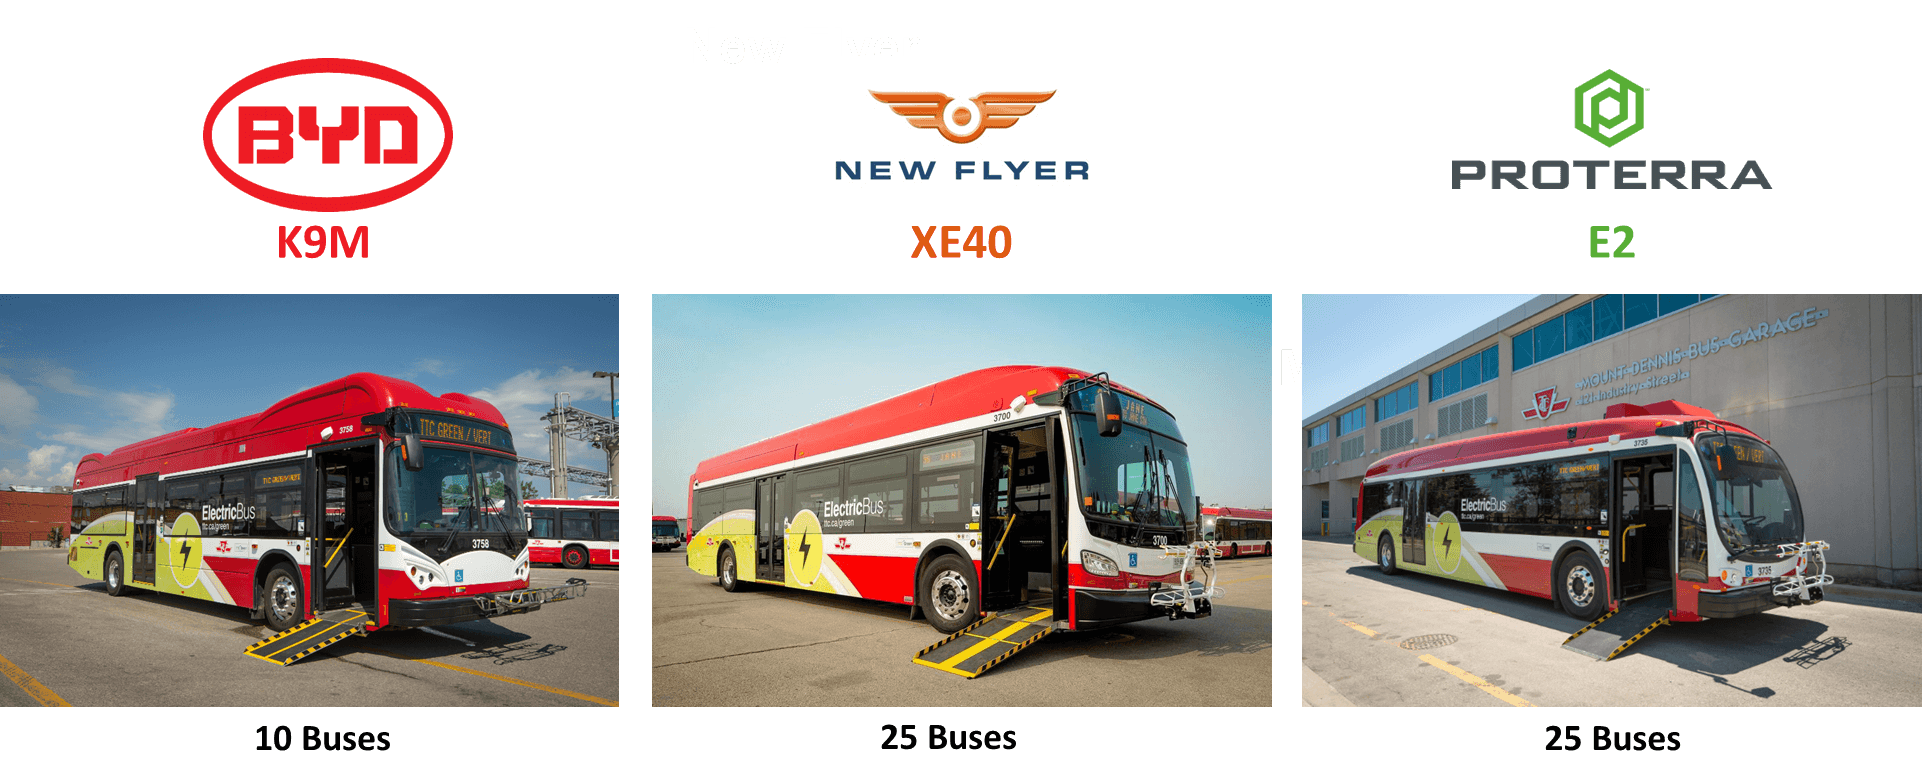
TTC used performance indicators of the HEV (Hybrid-Electric Vehicle/Bus) supplied by Nova Bus, launched in 2018, as a baseline for comparison with electric buses. The electric buses were evaluated on 9 key parameters:
- System Compatibility
- Accessibility
- Vehicle Performance
- Vendor Performance
- Charging System Performance
- Customer Experience
- Operator Experience
- Maintainer Experience
- Maintainability
- Total Lifecycle Cost
TTC is planning to procure 1,826 electric buses by 2040 and has issued its first large-scale electric buses Request for Proposal (RFP) for 240 buses in April 2022. The agency will procure approx. 600 electric buses between 2022 and 2031. The head-to-head evaluation was very useful for TTC to understand the technical capabilities of each type of bus and evaluation of operating environments.
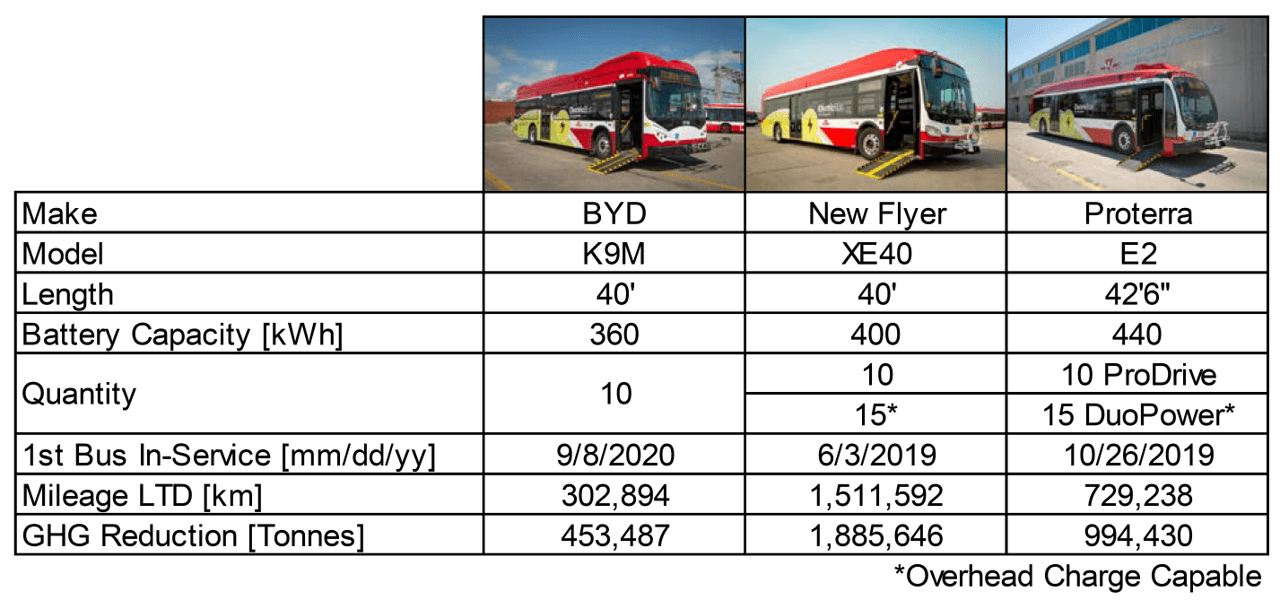
The details performance report on each key parameter is as follows:
System Capability
This is a ‘must-have’ requirement for TTC, covering three key components:
- Physical compatibility with existing garages: 40 meters
- Interoperable charging technology: SAE Standards
- Corrosion-resistant frame structure: Stainless steel body

Accessibility
The vehicles should be compliant with local regulations – Canadian Standards Association (CSA) D435 standard for accessible transit buses and the Accessibility for Ontarians with Disabilities Act (AODA).

Vehicle Performance
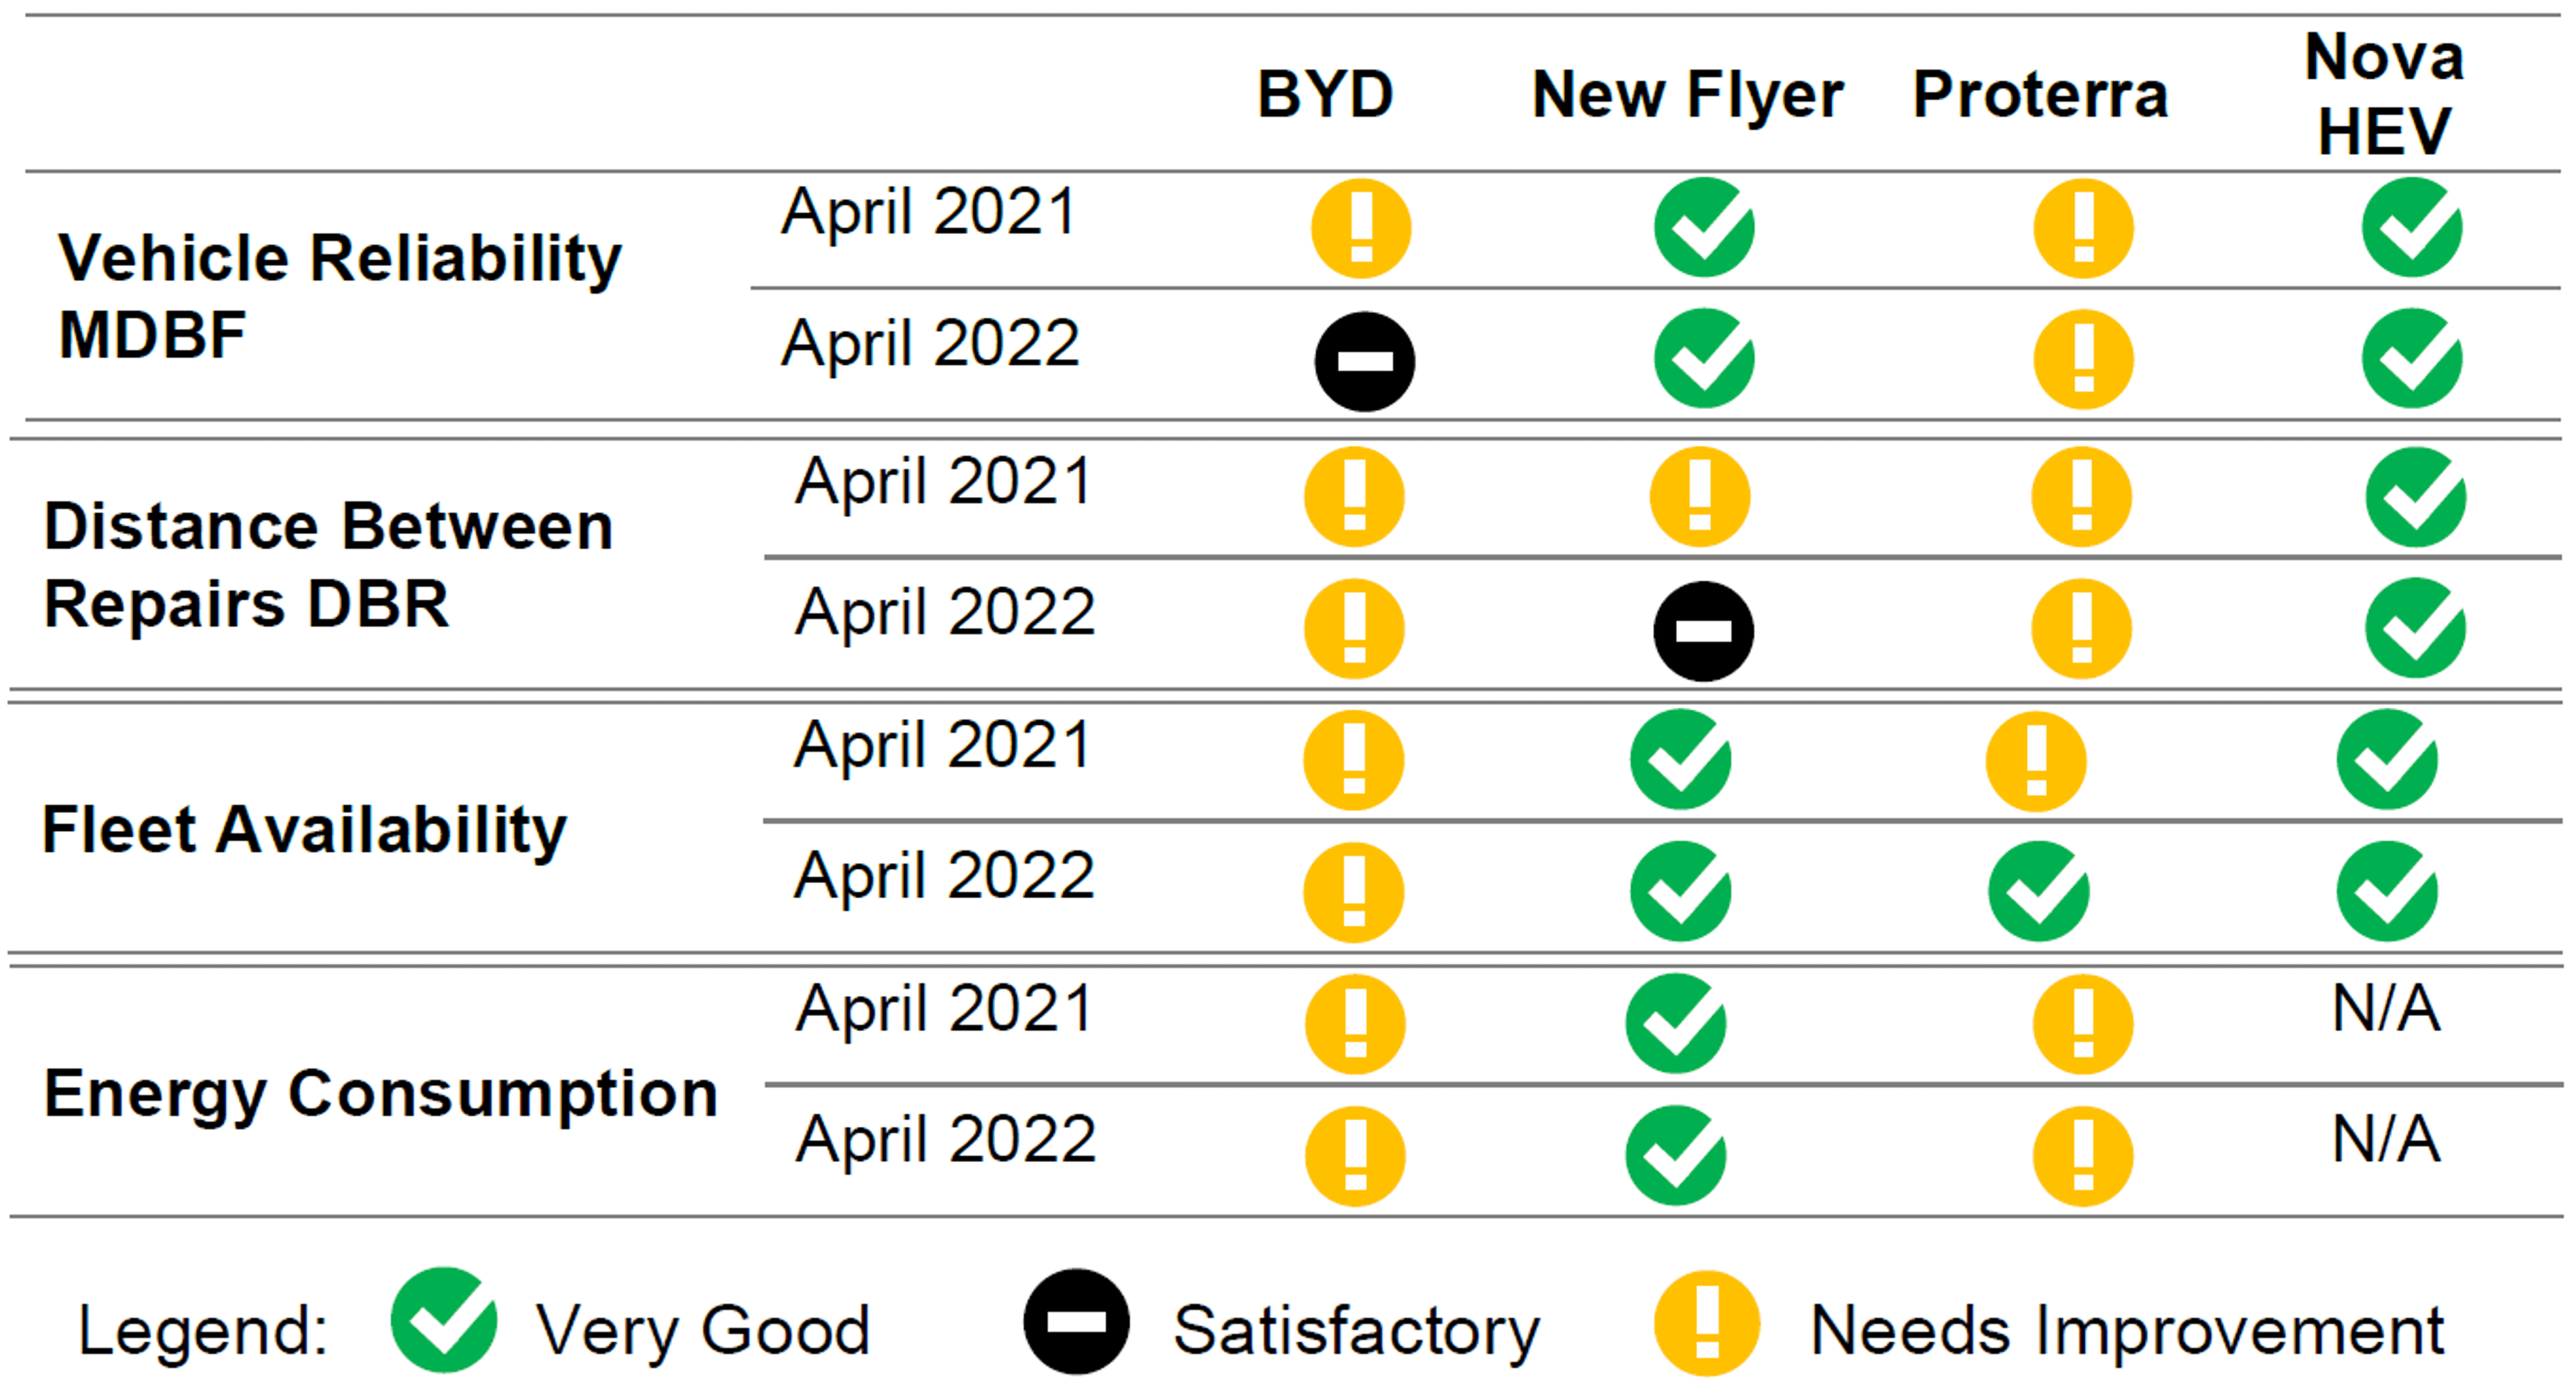
This measures the in-service performance from the time the vehicles entered service on the following parameters:
Reliability – calculating the Mean Distance Between Failures (MDBF)
Distance Between Repairs – calculated by summing the distance traveled by a bus fleet and dividing it by the number of defect repairs over a defined period of time
Fleet Availability – availability of the bus for use when needed, 80% fleet availability was targeted
Vehicle energy consumption – calculated energy consumption under different circumstances – In-service (InS) energy consumption / Head to Head (H2H) Engineering Controlled Test / HVAC Stationary Test
Vendor Performance
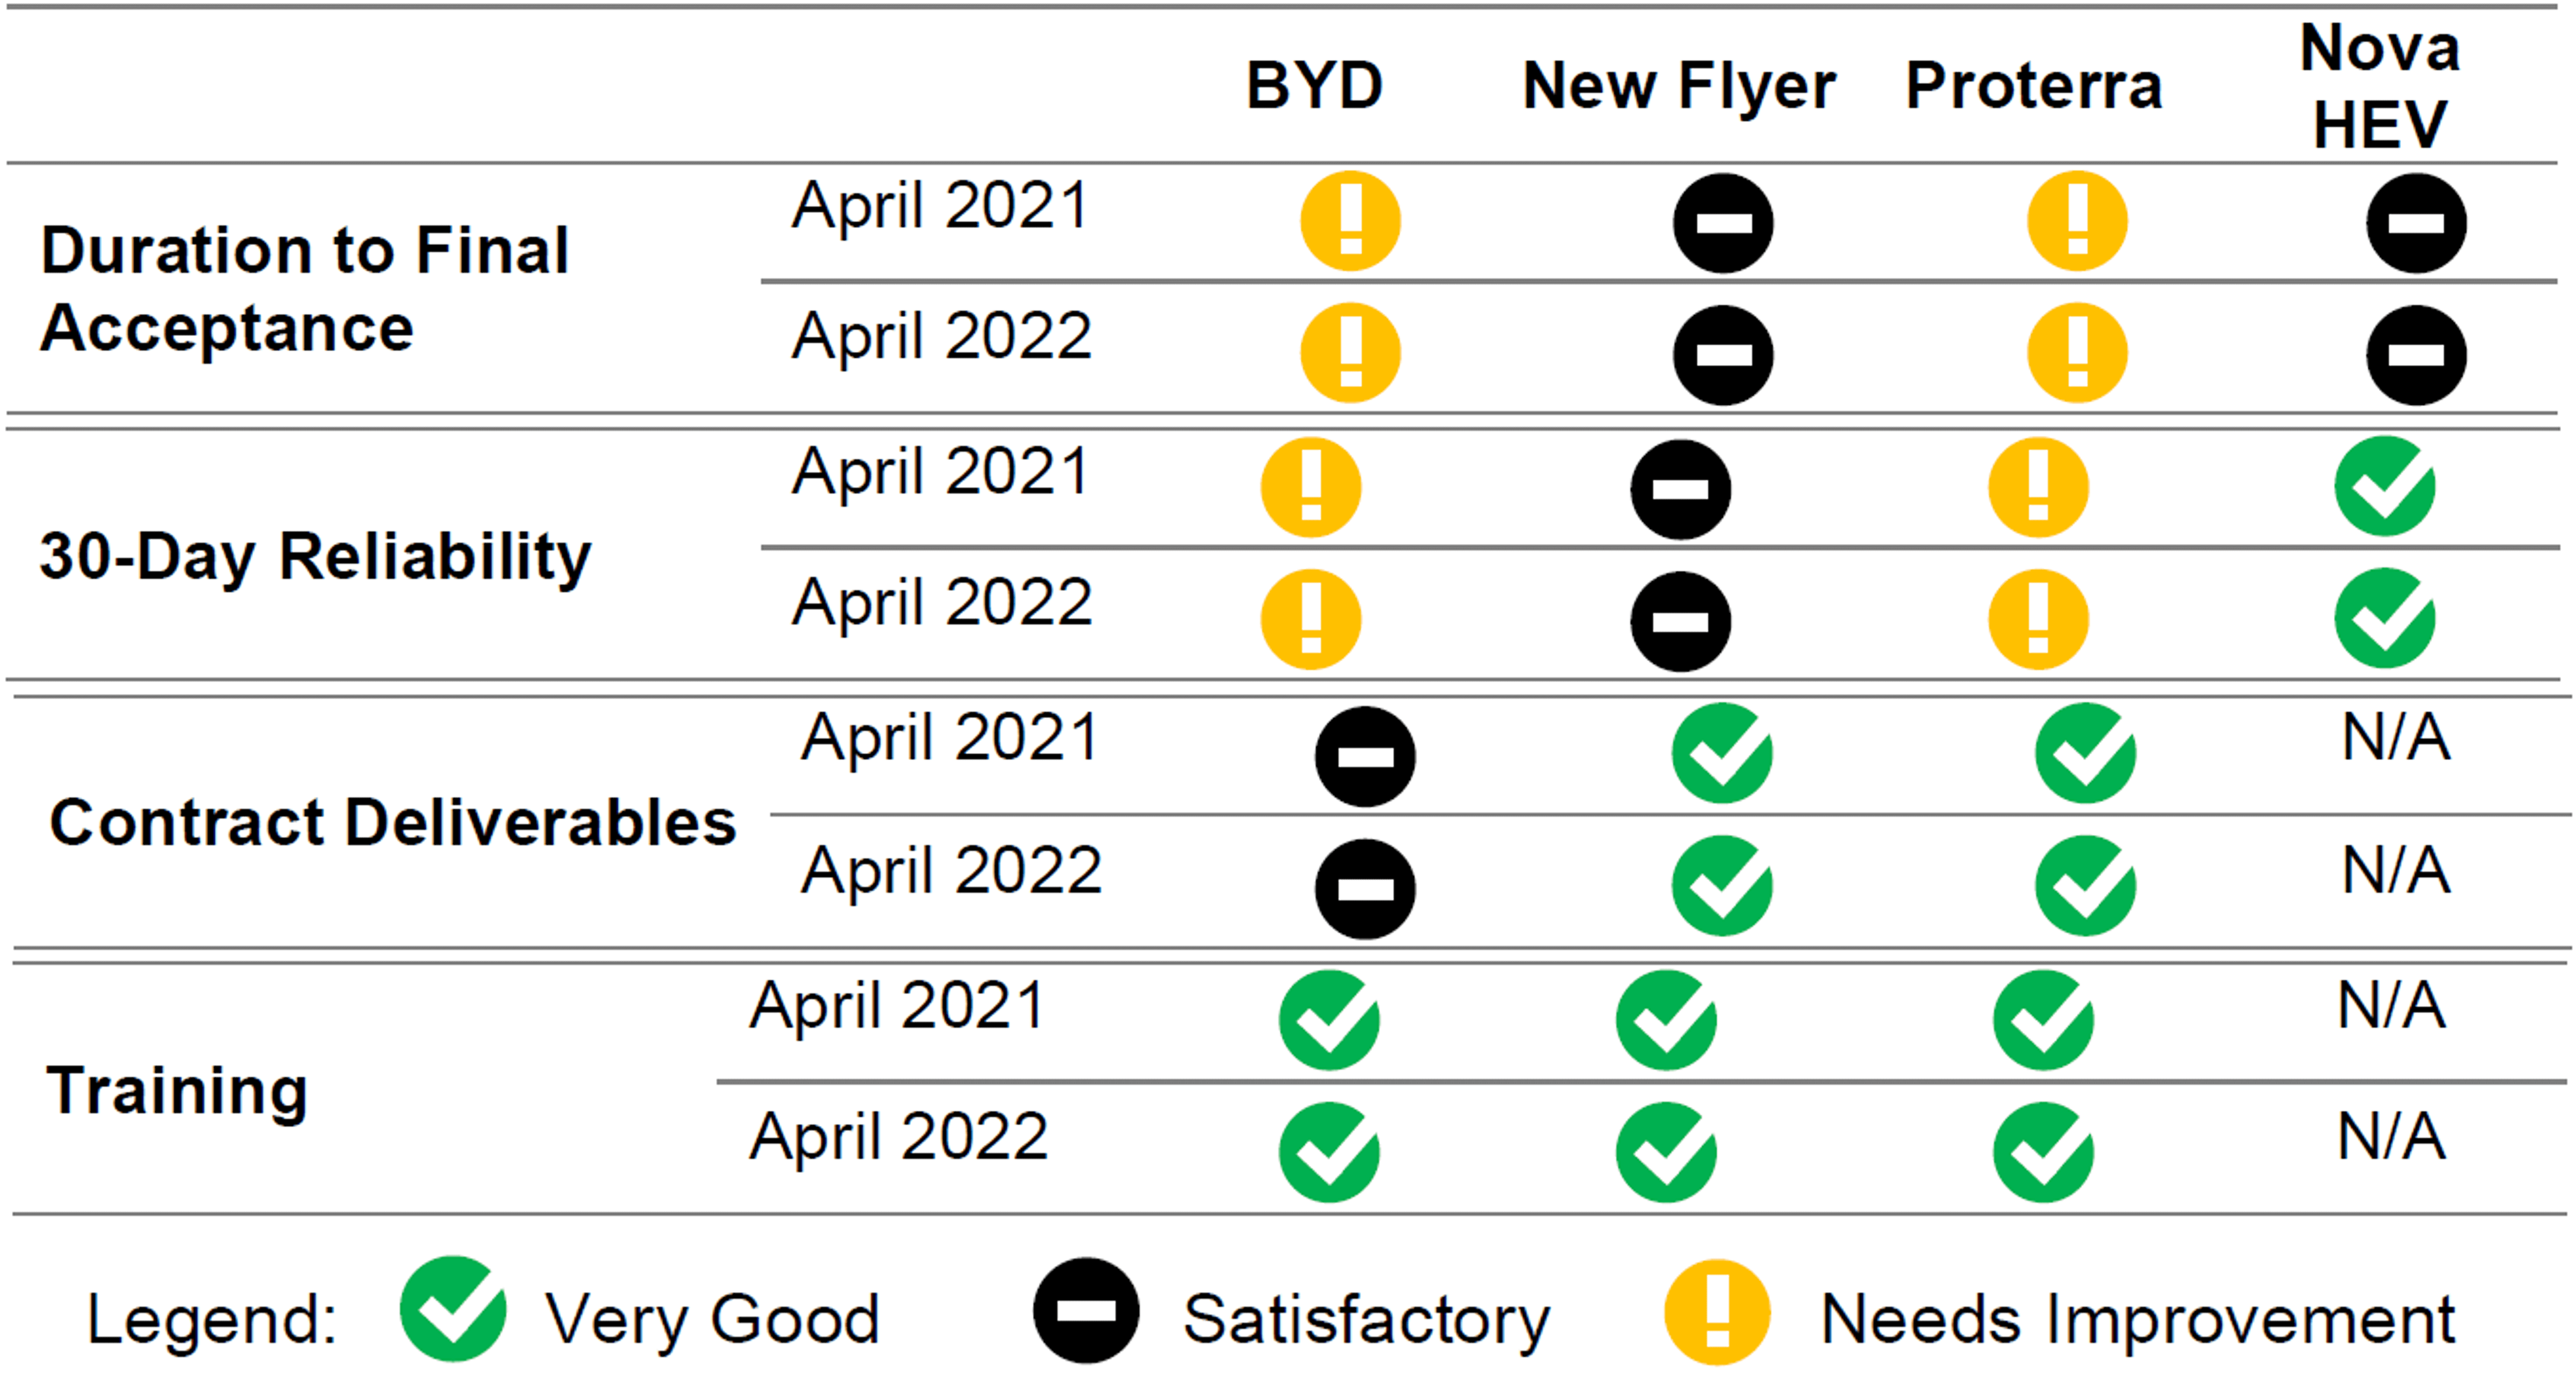
This measures the bus manufacturers’ quality and contractual obligations, based on the following metrics:
- Compliance to the vehicle delivery schedule
- Manufacturing facility quality audit
- Quality defects (snags)
- Duration to final acceptance
- 30-day reliability
- Contract deliverables
- Canadian content review
- Training
Charging System Performance
This measures the charging system provided by the manufacturer. BYD uses an AC Fast Charing system (Proprietary). NFI and Proterra use DC Fast Chargers (ABB model HVC-150).

Customer Experience
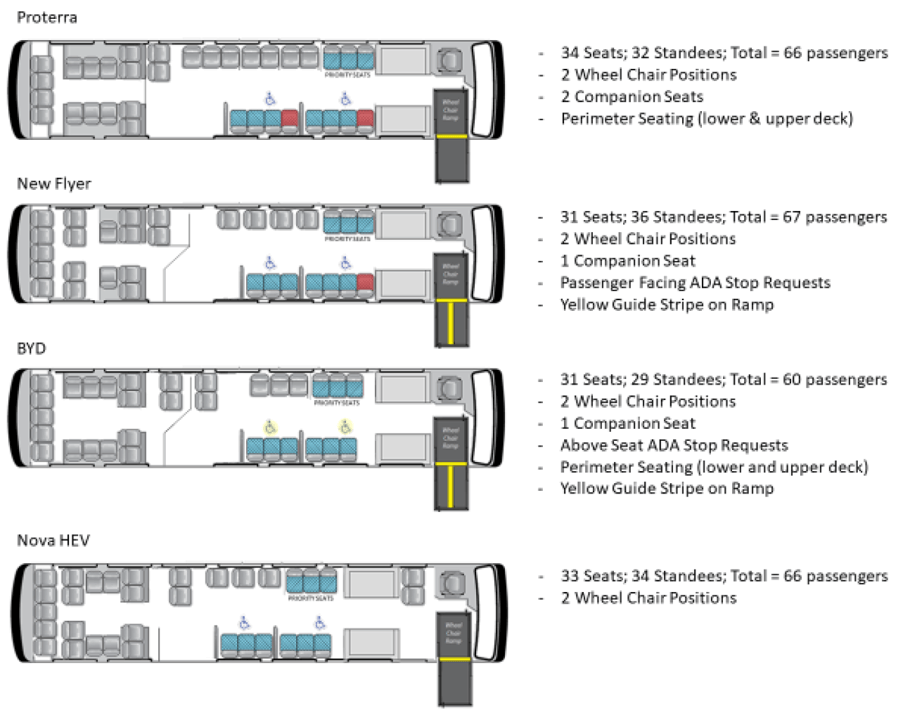
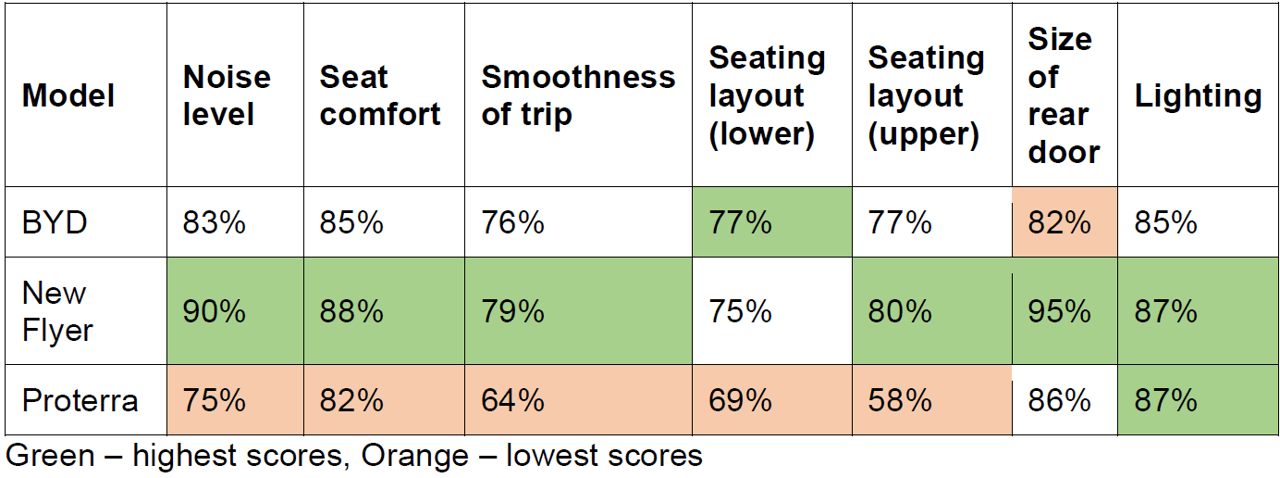
This focuses on understanding the likes and dislikes of customers with respect to the various configurations and features found on the three electric bus types.

Operator and Maintainer Experience
This focuses on understanding the likes and dislikes of operators and maintainers with respect to the various configurations and features found on the three electric bus models.

Maintainability
This measures the average time required to repair a bus defect, including the difficulty of repair and parts availability.

Total Lifecycle Cost
This measures both the capital and operating costs of an electric bus relative to a diesel bus over the 13-year life of a bus.

Sorry, the comment form is closed at this time.


Pingback: AC Transit Zero Emission Transit Bus Technology Analysis – Diesel Vs. Hybrid Vs. Electric Vs. Fuel Cell - Mobility Innovators
Pingback: AC Transit Zero Emission Transit Bus Technology Analysis – Diesel Vs. Hybrid Vs. Electric Vs. Fuel Cell (Volume 4) - Mobility Innovators