

AC Transit Zero Emission Transit Bus Technology Analysis – Diesel Vs. Hybrid Vs. Electric Vs. Fuel Cell (Volume 4)
The Alameda-Contra Costa Transit District (AC Transit) is the largest public bus-only transit agency in California, operating 101 fixed routes and 630 buses. AC Transit is one of the earlier adopters of zero-emission buses, pursuing opportunities and determining the feasibility of reduced emission and zero emission technologies for nearly 20 years. The agency has built the most comprehensive ZEB (Zero-Emission Bus) Program in the United States that has generated over 5 million miles and eliminated over 12,800 metric tons of CO².
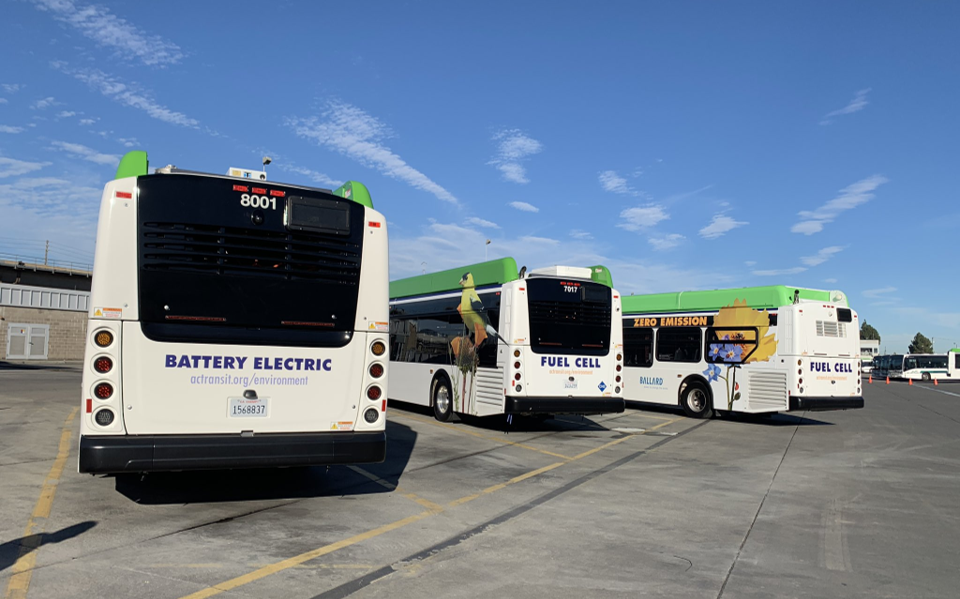
Currently, the agency has a fleet of twenty-seven (27) active ZEBs used in service, which include:
- Seven (7) 40-foot battery electric buses
- Nineteen (19) 40-foot fuel-cell electric buses
- one (1) 60-foot hydrogen fuel-cell electric demonstration bus
Further, the agency set up a hydrogen station in 2014 with a capacity of fueling 13 buses and 6 DC-fast charging stations in 2020 with a maximum output of 125kW.
The agency published the 4th edition of the Zero Emission Transit Bus Technology Analysis report, representing data collected on energy, capital, and operating costs, performance metrics, mileage, reliability, and availability from January 2022 through June 2022. This is one of the most comprehensive studies, conducting a side-by-side evaluation of ZEB technologies by a single transit agency, in the same service environment using the same ZEB bus manufacturers, in comparison to conventional diesel bus technologies.
AC Transit released Volume 3 of the report in June 2022. Toronto Transit Commission (TTC) published a report comparing head-to-head evaluations of electric Buses in Toronto.
Transit Bus Technology Overview
The study compares 5 different technologies for the period of 6 months (January 2022 – June 2022):
- Diesel – recorded highest fleet mileage (116,627 km) and more reliable
- Hybrid
- Fuel Cell
- Electric – lowest cost per mile (CPM)
- Legacy Fuel Cell – least reliable and highest cost per mile

Bus Fleet Specifications
The buses selected are all 40-foot local route units spanning the manufacturing years 2010 through 2019.

Facility Infrastructure – Investment
AC Transit has developed a charging infrastructure and a fuel cell station at a couple of facilities. The agency is building two additional battery electric bus charging facilities by 2024 and H2 station.

Mileage by Technology
An ideal mileage target is operating the bus approximately 150 miles per day over a 30-day period. A bus achieves 4,500 miles per month giving a test fleet a total of 22,500 miles per month.

Fuel Efficiencies and Equivalents (M/DGE)
AC Transit utilized the Argonne National Laboratory GREET (Greenhouse Gases, Regulated Emissions, and Energy Use in Transportation) model, to construct Miles Per Gallon Equivalents (M/DGE) for the various energy fuels utilized.

Maintenance and Energy Costs
Cost per mile (CPM) is the best measure to compare different technologies. The study divided operating expenses (Labor and Materials and Energyare) by the vehicles mileage to calculate the CPM.

Conclusion
The report provides great insights into the development stage of different technologies. AC Transit will continue to deploy the ZETBTA control fleet and collect performance data to provide a follow-up report for the review period of January to July 2022 targeted for delivery in the winter of 2022.
Loading Viewer...