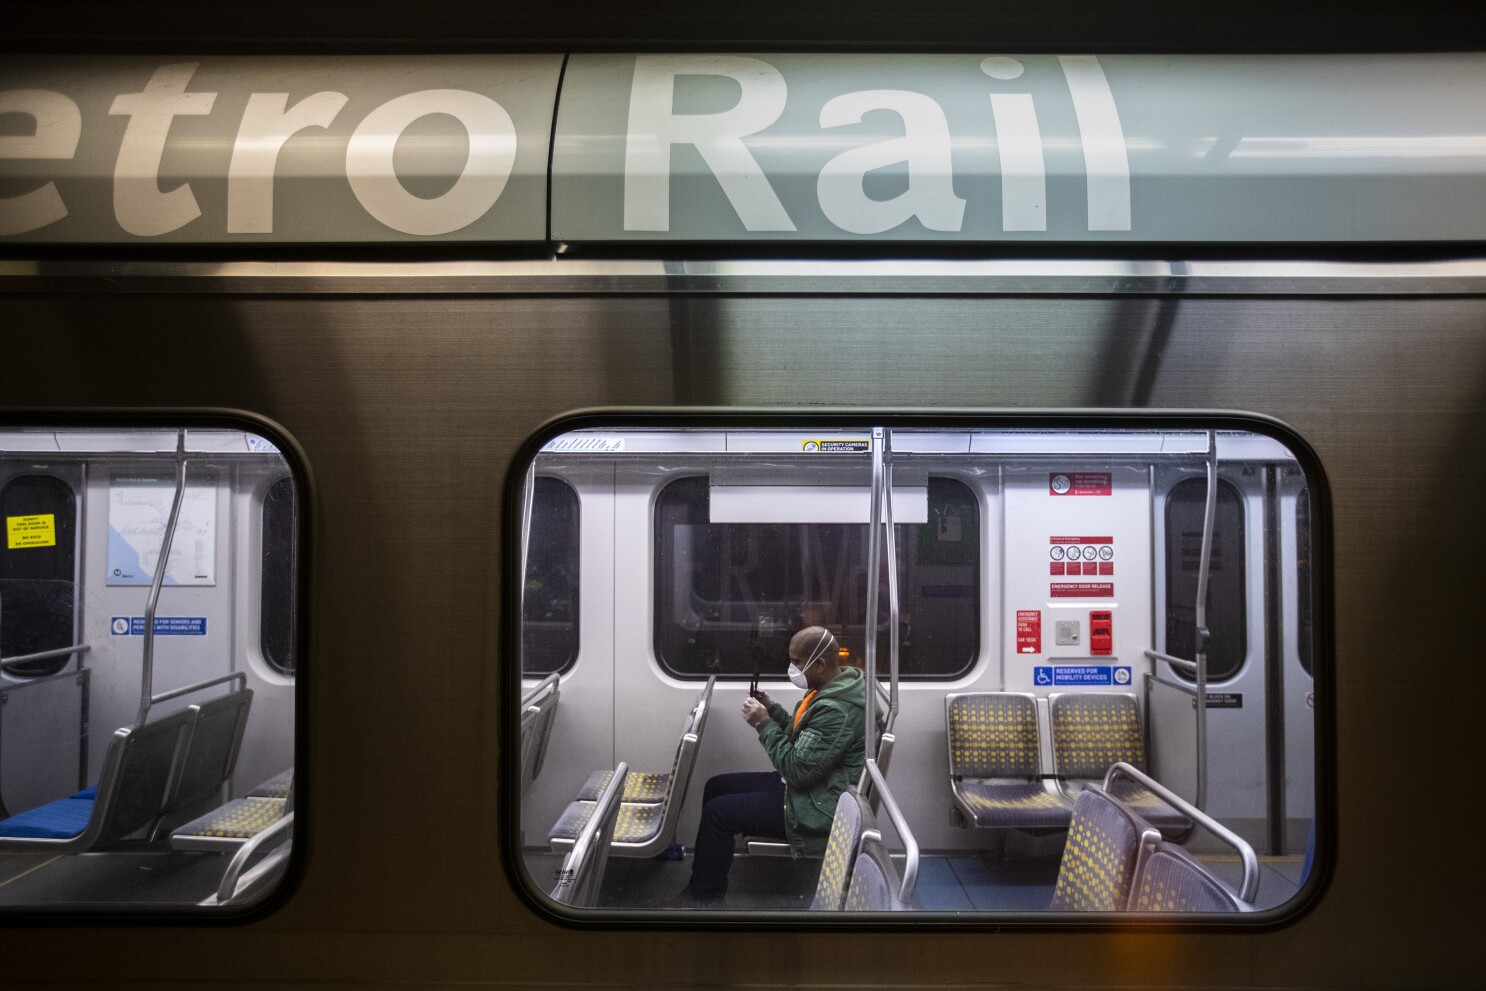
Impact of Covid-19 on Transit Sector and Movements of People around the World
The pandemic has had a significant impact on public transportation operators all over the world. Ridership dropped by 10-20% as a result of various measures such as lockdown, school and college closures, work-from-home policies, capacity restrictions, event cancellations, and restrictions on tourist activities. These precautions were critical in preventing the virus’s spread. However, even after some of these measures have been lifted, public transportation operators continue to suffer as a result of some key behavioral changes, such as:
- Preference to work from home
- Relying on private transport
- Reduction in the business travel
During the pandemic, Google launched its COVID-19 Community Mobility Reports. These reports provided key insights into the impact of government policies on people’s behaviors in a variety of settings, including retail and recreation, grocery and pharmacy, parks, transit stations, workplaces, and residential. These reports use anonymized Google Maps data to show how visits and length of stay at various locations change compared to a baseline (median value of week period Jan 3–Feb 6, 2020).
Google has shared an updated dataset showing changes in people’s movements throughout the pandemic on a regular basis. The most recent data is from December 27, 2021. Our World in Data did an incredible job of presenting Google’s data in interactive charts below to make it easier to see changes over time in a given country, as well as how specific policies may have affected (or not) behavior across communities.
Public transport stations
This interactive chart shows how the number of visitors to transit stations has changed compared to baseline days (the median value for the 5‑week period from January 3 to February 6, 2020). This includes public transport hubs such as subway, bus, and train stations. This index is smoothed to the rolling 7-day average.
Public transportation was seriously impacted as a result of frequent lockdowns and work-from-home behavior. The countries regained their ridership between November 2020 and December 2021. However, due to the Omicron variant, it started to drop after December 10, 2021. Ridership is down by more than 30% in the United Kingdom, Sweden, and Switzerland.
Time spent at home
This interactive chart shows how the number of visitors to residential areas has changed compared to baseline days (the median value for the 5‑week period from January 3 to February 6, 2020). This index is smoothed to the rolling 7-day average.
Most countries’ workplace visits have never fully recovered. This demonstrates that the preference for working from home will persist even after the lockdown is lifted.
Workplace visitors
This interactive chart shows how the number of visitors to workplaces has changed compared to baseline days (the median value for the 5‑week period from January 3 to February 6, 2020). This index is smoothed to the rolling 7-day average.
According to the data, there has been a significant increase in the amount of time spent at home. People prefer to stay at home rather than travel because of travel restrictions.
Hannah Ritchie, Edouard Mathieu, Lucas Rodés-Guirao, Cameron Appel, Charlie Giattino, Esteban Ortiz-Ospina, Joe Hasell, Bobbie Macdonald, Diana Beltekian and Max Roser (2020) – “Coronavirus Pandemic (COVID-19)”. Published online at OurWorldInData.org. Retrieved from: ‘https://ourworldindata.org/coronavirus’ [Online Resource]


